
Local air quality reporting has become a critical resource of health-based news for people across the globe. There are several sources for the information, for example, the U.S. Air Quality Index, indices of individual countries, NowCast and others.
The U.S. Air Quality Index (U.S. AQI) was developed by the United States Environmental Protection Agency (U.S. EPA) for reporting and forecasting daily air quality. The website AirNow is one of the places the information can be found.1 It uses colour-coded categories for current reports and forecasts for the five of the six major pollutants that are regulated by the Clean Air Act: ozone, particle matter, carbon monoxide, nitrogen dioxide and sulphur dioxide. Each index is a function of the pollutant concentration in the air over a certain period of time. AirNow offers NowCast, which it terms as “current air quality.”2
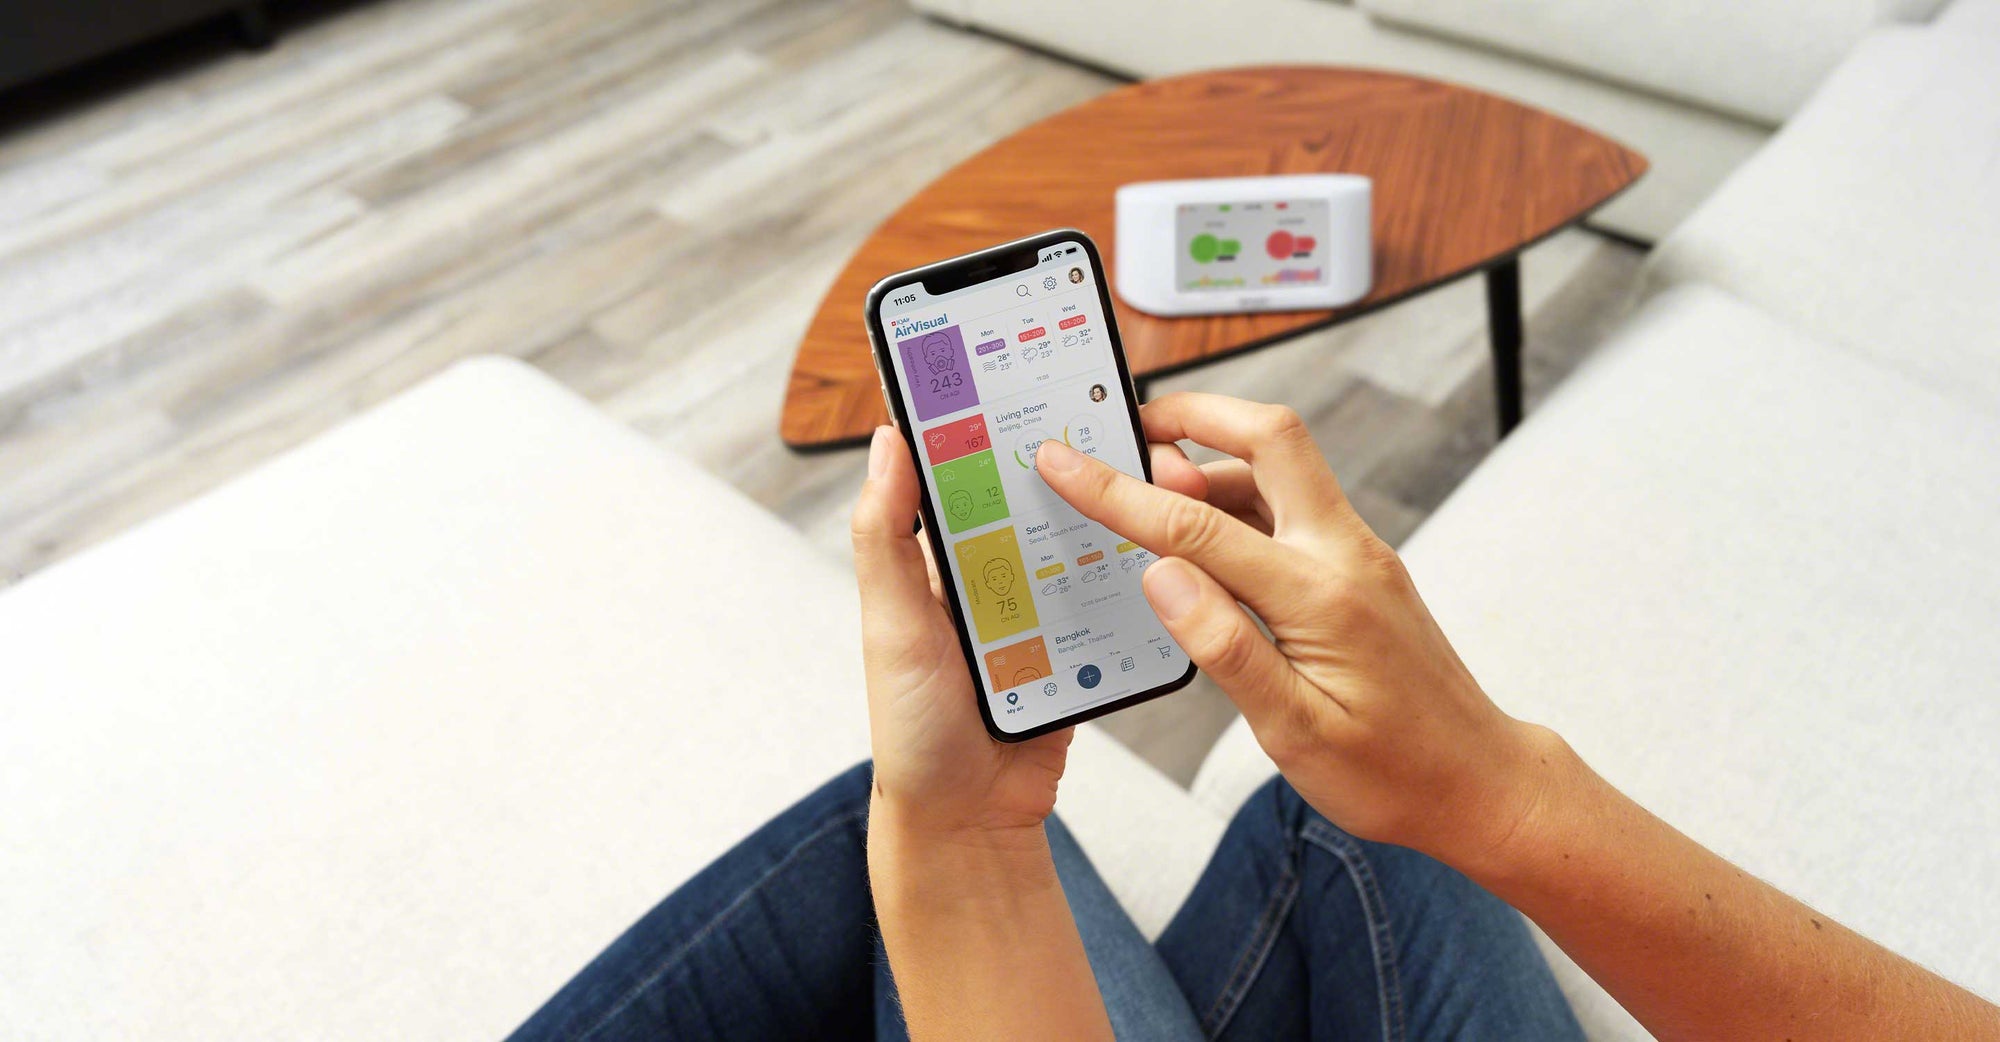
The AirVisual Platform is IQAir’s air quality monitoring platform. AirVisual data comes from governmental stations and low-cost sensors owned by citizen scientists around the world: a combined total of over 80,000 locations, which is used to calculate AirVisual’s AQI. Ozone levels are reported by government stations.
Other reports provided by AirVisual include a 24-hour air quality history, an air quality forecast, and health recommendations.
IQAir AirVisual vs. NowCast data
AirVisual updates its online air quality information hourly based on the average of the previous hour’s measurements (except on occasions such as when a public outdoor station or governmental station goes offline). The NowCast AQI is also updated hourly but to calculate those values, an extended time frame is used.3 For PM numbers, it’s a 12-hour weighted average. The U.S. AQI updates once daily and is an average from the previous 24-hour period.
Why differences in reports occur
Differences between AirVisual data and other air pollution information providers do sometimes happen. Reasons include:
- Difference in averaged intervals: AirVisual averages the last hour whereas NowCast averages the last 12 hours. The 11-hour difference in intervals can be dramatic, especially during the beginning of a large pollution episode.
- Update frequency: various apps and websites, particularly those relaying source data, can update at different times. AirVisual updates hourly, more often than other sources.
- Air pollution index differences: Many countries have their own air pollution index, and some apps have also crafted their own system for representing the level of risk in the air. IQAir AirVisual uses the same hazard scale and colour code system as the US AQI, and also uses the same standard values to calculate, but it does not use the same time averaging periods.
- Data source: Different sources may be representing different source data. IQAir AirVisual displays both official government and low cost sensor (LCS) data together on one platform. Not all apps, however, will display the same data set.
The conclusion
The U.S. Air Quality Index, NowCast and IQAir AirVisual are three of the main sources of air quality reporting. The U.S. AQI updates daily and is an average of the past 24 hours. AirVisual AQI updates hourly with an average of the past hour’s measurements. NowCast updates hourly as well, but the time period used to get a weighted average can be up to 12 hours.
Differences between air quality providers can be due to a number of reasons besides update frequency and time-averaging periods.
The number one air cleaning solution for your home.
Lorem ipsum Donec ipsum consectetur metus a conubia velit lacinia viverra consectetur vehicula Donec tincidunt lorem.
TALK TO AN EXPERTArticle Resources
Article Resources